Data Analysis and Visualization
We Visualize Your Data to give you valuable insights
Data visualizations options
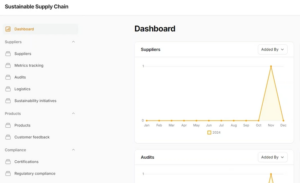
Date Based Line chart
Based on dates of your entries with option to select which date type to choose for the display, i.e. release date, manufacture date or inspection date.
Money Based Line Chart
This type sums money-related values of your entities by date, i.e. maintenance expenses by date.
Pie chart
Based on statuses, types or other "dropdown-list" like fields of your entities. I.e. split by training type, maintenance type, quality pass type and more.
Filters with Bookmarks
You can filter data displayed on your dashboard by author, group by day, month, week, year. In addition to that, you can select period for the visualization, i.e. last week, next month or even custom period. Each combination of these filters can be remembered as a bookmark.
Questions? Comments?
Let us know, our product team is ready to help.


